
Stock analysis helps investors and traders understand a company before making a market decision. Instead of looking only at whether a stock price is rising or falling, proper stock analysis looks at the company, financial numbers, valuation, price trends, volume, market conditions, and risks.
In India, you can use broker platforms, financial websites, screeners, charts, annual reports, and research tools for this work. Some people also use AI tools such as ChatGPT to organise information and create an analysis checklist.
In this guide, I will explain stock analysis in simple language, including fundamental analysis, technical analysis, useful tools, AI prompts, common mistakes, and practical checks for Indian investors.
What Is Stock Analysis?
Stock analysis is the process of studying a stock to understand its business, financial position, valuation, price behaviour, and possible risks.
There are two major approaches:
- Fundamental analysis
- Technical analysis
Investors often focus more on fundamentals, while short-term traders may give greater importance to technical analysis. Many market participants use both.
The purpose is not to predict the future with certainty. No analysis can guarantee that a stock will rise or fall.
Fundamental Analysis of a Stock
Fundamental analysis looks at the actual business behind a stock.
For example, suppose you are studying an Indian company. You may want to know:
- What does the company sell?
- How does it make money?
- Is revenue growing?
- Is profit growing?
- How much debt does it have?
- Is cash flow healthy?
- What is its valuation?
- What risks can affect the business?
Revenue and Profit
Revenue shows how much money a company generates from its business.
Profit shows what remains after expenses.
Do not look at only one year’s profit. I prefer looking at several years of financial data to understand the broader trend.
A company with rising revenue and profit may look healthier than one where profits are falling. However, growth alone does not make a stock attractive.
Earnings Per Share
Earnings per share, or EPS, shows the company’s profit attributable to each outstanding share.
It can help investors compare earnings over different periods.
However, EPS should be considered together with other financial measures rather than used alone.
Debt
Debt can help a company expand, but excessive debt can also create problems.
When analysing a company, check:
- Total debt
- Interest expenses
- Debt-to-equity ratio
- Cash available
- Ability to generate operating cash
A company with high debt may face greater pressure when interest costs rise or business conditions become difficult.
Cash Flow
Profit and cash flow are not exactly the same.
A company can report accounting profits while having weak cash generation.
That is why I would not ignore the cash-flow statement.
Look at operating cash flow and compare it with reported profits over several years.
Valuation Matters
A good business does not automatically mean a good investment at every price.
Valuation tells you how much the market is paying for the company’s earnings, sales, assets, or other measures.
Common valuation measures include:
- P/E ratio
- P/B ratio
- Price-to-sales ratio
- EV/EBITDA
- Dividend yield
P/E Ratio
The price-to-earnings ratio compares the share price with earnings per share.
For example, if a company’s share price is ₹200 and its EPS is ₹10, its P/E is 20.
A high P/E can mean investors expect strong future growth. But it can also mean the stock is expensive relative to its current earnings.
A low P/E does not automatically mean a stock is cheap. The company may have weak growth, high debt, business problems, or other risks.
Always compare valuation with the company’s growth, industry, profitability, and business quality.
Technical Stock Analysis
Technical analysis mainly studies price and volume data.
Instead of asking, “Is this company fundamentally strong?”, technical analysis asks questions such as:
- What is the current trend?
- Where are important support levels?
- Where is resistance?
- Is volume increasing?
- Is momentum strengthening or weakening?
- Is the price above or below important moving averages?
Also Read: kotakneo.net
Support and Resistance
Support is a price area where buying interest has previously appeared.
Resistance is a price area where selling pressure has previously appeared.
These are not guaranteed turning points.
A support level can break. A resistance level can also be crossed.
That is why risk management is important when using technical analysis.
Moving Averages
Moving averages smooth price data and help traders identify trends.
Common examples include:
- 20-day moving average
- 50-day moving average
- 100-day moving average
- 200-day moving average
For example, some traders watch whether a stock remains above its 50-day or 200-day moving average.
But a moving average is a lagging indicator. It is based on past prices and should not be treated as a prediction machine.
RSI
The Relative Strength Index, or RSI, measures recent price momentum on a scale from 0 to 100.
Many traders commonly use 70 and 30 as reference levels.
An RSI above 70 is often called overbought, while an RSI below 30 is often called oversold.
However, overbought does not necessarily mean “sell”, and oversold does not necessarily mean “buy”.
A strong stock can remain overbought for a long time.
Stock Analysis App India: What Should You Look For?
There are many options for stock research in India. Your broker may provide charts and basic research tools. Other financial platforms may provide screeners, financial statements, ratios, news, and corporate information.
When choosing a stock analysis app India users should consider:
- Financial data quality
- Charting tools
- Stock screeners
- Company results
- Corporate announcements
- Ease of use
- Mobile performance
- Data update frequency
- Costs, if any
- Availability of advanced features
Do not choose a platform simply because it has a large number of indicators.
For a beginner, a clean interface with reliable information can be more useful than a screen filled with complicated tools.
Also check the latest pricing and feature information directly with the platform because services and charges can change.
Stock Analysis Websites
You can find useful information across several types of stock analysis websites.
A good research process may involve:
Company Sources
Start with the company’s official investor-relations information.
Look for:
- Annual reports
- Quarterly results
- Investor presentations
- Shareholding information
- Corporate announcements
- Financial statements
These sources are particularly useful because they provide information directly from the company.
Exchange Information
For Indian listed companies, investors can also check information published by recognised stock exchanges and regulatory sources.
This can help verify corporate announcements and market-related information.
Financial Research Platforms
Third-party financial websites can make it easier to compare:
- Revenue
- Profit
- Margins
- Debt
- Valuation ratios
- Historical financial performance
I recommend using these websites as research tools rather than blindly accepting their ratings or conclusions.
How I Would Structure a Stock Analysis
If I were preparing a basic research checklist, I would follow a simple order.
Step 1: Understand the Business
First, understand how the company makes money.
If you cannot explain the business in simple words, spend more time researching it.
Step 2: Check Financial Performance
Review several years of:
- Revenue
- Operating profit
- Net profit
- EPS
- Cash flow
- Debt
Look for consistency rather than focusing on one impressive quarter.
Step 3: Study the Industry
A company does not operate in isolation.
Check:
- Industry growth
- Competition
- Regulations
- Commodity costs
- Interest rates
- Demand conditions
- Major business risks
Step 4: Check Valuation
Compare the company’s valuation with its own history and suitable industry peers.
Do not use a single ratio to decide whether a stock is cheap or expensive.
Step 5: Study the Chart
If you are also using technical analysis, check:
- Trend
- Support
- Resistance
- Volume
- Moving averages
- Momentum
Step 6: Identify Risks
Ask yourself what could make your analysis wrong.
For example:
- Falling demand
- Rising debt
- Lower margins
- Strong competition
- Regulatory changes
- Poor cash flow
- Management concerns
- High valuation
This step is often ignored, but I consider it one of the most useful parts of stock analysis.
Using a Stock Analysis Prompt
AI tools can help organise research, but they should not replace financial documents or your own judgement.
A stock analysis prompt can tell an AI tool what areas you want it to examine.
For example, you can ask it to create a checklist covering:
- Business model
- Revenue growth
- Profit growth
- Margins
- Debt
- Cash flow
- Valuation
- Industry position
- Risks
- Recent developments
- Technical trend
The quality of the result depends heavily on the information provided.
If the data is incorrect, incomplete, or outdated, the analysis can also be unreliable.
ChatGPT Stock Analysis Prompt Example
A structured ChatGPT stock analysis prompt can look like this:
Analyse [Company Name] as an educational research exercise for an Indian investor.
Cover the company’s business model, main revenue sources, recent revenue and profit trends, margins, debt, cash flow, EPS, valuation ratios, industry position, major competitors, management-related considerations, recent company developments, and key risks.
Separate verified facts from assumptions. Do not predict guaranteed returns. Clearly mention which information needs to be checked against the latest annual report, quarterly results, exchange filings, or official company sources.
For technical analysis, explain the current trend, major support and resistance areas, volume behaviour, moving averages, and momentum indicators if reliable price data is available.
Finish with a balanced summary of potential strengths, weaknesses, and questions an investor should research further. This is educational information, not personalised investment advice.
This type of prompt is more useful than simply asking, “Will this stock go up?”
The second question encourages a prediction. A structured prompt encourages research.
Common Stock Analysis Mistakes
Looking at Only the Share Price
A ₹100 stock is not automatically cheaper than a ₹1,000 stock.
The number of shares, earnings, valuation, and business size all matter.
Using Only One Indicator
A trader may see an RSI below 30 and assume a stock must rise.
That is risky.
Indicators should be considered with price action, trend, volume, market conditions, and other relevant information.
Ignoring Valuation
Strong earnings do not automatically justify any share price.
Valuation remains important.
Ignoring Debt
Rapid growth can sometimes hide a rising debt burden.
Always check the balance sheet.
Depending Completely on AI
AI can help organise information and explain financial concepts.
But it can also produce incorrect or outdated information.
For important financial data, verify the figures against reliable primary sources.
Chasing Recent Winners
A stock that has risen sharply may attract attention.
But buying after a large move simply because other people are making money can lead to poor decisions.
Study the business and valuation before making any decision.
How to Make Stock Analysis More Practical
I suggest keeping your research simple.
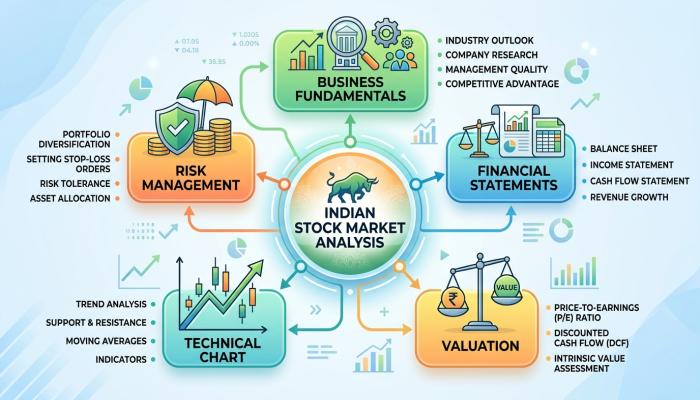
Create a checklist with five broad areas:
Business: Do I understand how it makes money?
Financials: Are revenue, profit, margins, debt, and cash flow reasonably healthy?
Valuation: What am I paying for the business?
Chart: What is the current price trend?
Risk: What could make my analysis wrong?
This approach can prevent you from becoming dependent on one ratio or one chart indicator.
Also write down your reasoning before taking a trade or investment decision. Later, you can review whether your original analysis was correct.
Who Can Use Stock Analysis?
Stock analysis can be useful for:
- Long-term investors
- Swing traders
- Positional traders
- Beginners learning about companies
- Experienced market participants reviewing ideas
The level of analysis should match the time horizon.
A long-term investor may spend more time studying financial statements and business quality.
A short-term trader may focus more on price action, volume, volatility, and market structure.
Neither approach guarantees success.
Final Things to Check Before Making a Decision
Before acting on your research, check:
- Is the financial data recent?
- Did you read the latest company results?
- Have you checked official filings?
- Do you understand the business?
- Is the valuation reasonable for the situation?
- What are the major risks?
- Does the technical setup support your intended time frame?
- What happens if your analysis is wrong?
- Are you risking money you cannot afford to lose?
Good stock analysis is not about finding certainty.
It is about making a decision with better information and understanding the risks involved.
FAQ
What is stock analysis?
Stock analysis is the study of a company’s business, financial performance, valuation, price movement, market conditions, and risks.
Which is better, fundamental or technical analysis?
Neither is automatically better. Fundamental analysis focuses mainly on the business and financial position, while technical analysis focuses mainly on price and volume. The suitable approach depends on your purpose and time horizon.
Which stock analysis app is good for Indian investors?
There is no single app that is best for everyone. Compare the latest features, data quality, charting tools, screeners, usability, and charges before choosing one.
Can ChatGPT do stock analysis?
ChatGPT can help organise research, explain financial concepts, create checklists, and analyse information you provide. Important financial figures should still be verified using current and reliable sources.
Can stock analysis guarantee profit?
No. Stock analysis cannot guarantee profits. Market prices are affected by many factors, and even well-researched decisions can lose money.
Conclusion
Stock analysis is a useful skill for anyone interested in the Indian stock market. It helps you move beyond simple questions like “Is this stock going up?”
A practical process combines business research, financial statements, valuation, technical information, market conditions, and risk assessment.
Tools such as stock screeners, financial websites, broker platforms, and AI can make research easier. But these tools should support your judgement, not replace it.
My main suggestion is simple: understand the business, verify the numbers, study the valuation, respect the chart, and always think about risk.
There is no shortcut that can remove uncertainty from the stock market.
Disclaimer
This article is for educational and informational purposes only. It is not financial, investment, or trading advice. Stock market investments involve risk, including possible loss of capital. Charges, features, financial data, and market information can change, so verify the latest details from official sources before making any financial decision.